In the original blog, "Truth, Lies, and Statistical Modeling in Supply Chain", John Skelton asked if I had not mistakenly used “too much inventory”instead of “too little inventory” in the highlighted section of the sentence below:
“If we determine safety stock based upon the average demand, which is the usual manner of determining safety stock, we are keeping too much inventory to satisfy ‘most’ demand – as measured by the mode, or peak, of the distribution – and yet too much inventory to satisfy peak demand – as measured by the upper 95% confidence limit.”
The graph below illustrates my position and also highlights the issue John is referring to in his question. I’ve chosen to focus on the curves for a CoV=2.5 because they have the greatest difference. At a 90% probability the LogNormal distribution’s value is 227 while the Normal distribution’s value is 420, meaning that by using a Normal distribution the peak demand is being overestimated by nearly 100%. It is only at about 98.2% probability that the curves swap over. Until then, the Normal distribution is overestimating the peak demand.
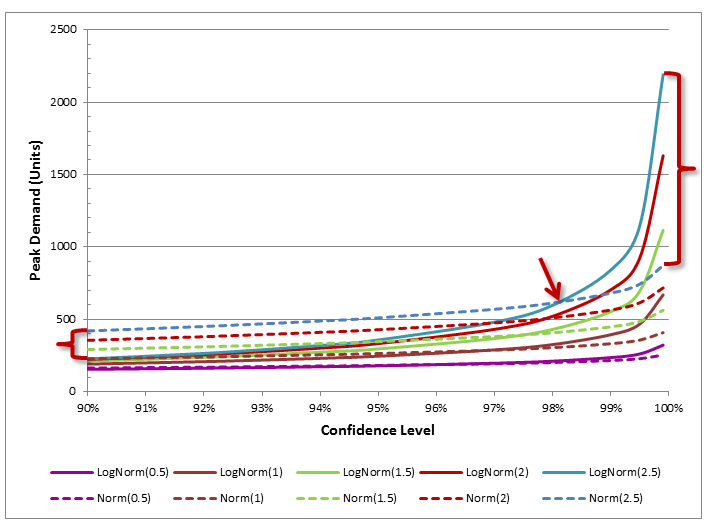
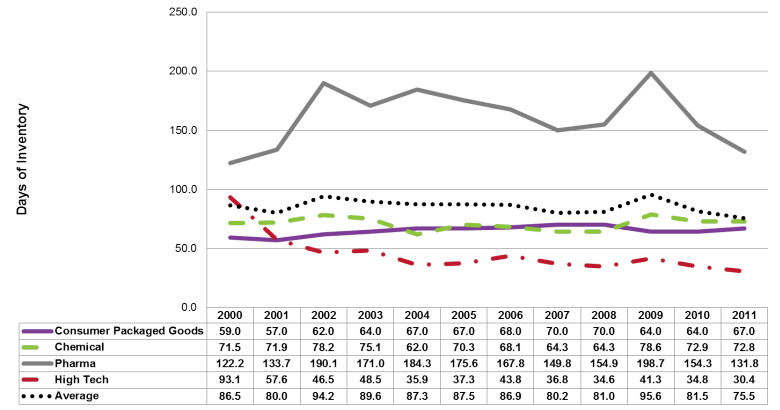
But John is correct above a 98.2% probability. By the time we get to a 99.9% probability using a Normal distribution, underestimates peak demand by 250%. Typically a Z value of 1.64 is used in the standard safety stock calculations which equates to a 95% confidence level. At this confidence level the Normal distribution is overestimating peak demand by 142%. As Lora Cecere has pointed out in a blog titled “Three Lies and a Truth”, only High-tech has achieved a material reduction in inventory over the past 10-12 years. My take is that this is because High-Tech has had to adopt postponement strategies because of rapid changes in product portfolio driven by globalization of demand and rapid changes in technology. They have had to become more responsive to demand changes and translate that demand change into a profitable response very quickly.
However, other industries have a shorter order-to-delivery cycle coupled with longer supply lead times, and therefore they have struggled to reduce inventories. In order to reduce inventory beyond our current levels we need to approach inventory management differently. We should be using inventory buffers to model fluctuation in demand and supply near the mode or ‘typical’ demand and address the issues of unusually large demand or unusually long lead times through risk identification and risk recovery mechanisms. In Make-to-Stock industries the typical risk mitigation issue of running higher inventories is satisfying neither our need for reduced working capital nor is it fully accounting for the risks which we are mitigating. This is a very ‘command & control’ approach which we need to augment with a ‘sense and respond’ approach which will allow us to reduce inventory while simultaneously reducing risk through early risk identification and rapid risk recovery. Know sooner; Act Faster. Of course the approach we will take will depend on our risk tolerance and ability to sense and respond quickly. More blogs in this series: Truth, Lies, and Statistical Modeling in Supply Chain – Part 1 Truth, Lies, and Statistical Modeling in Supply Chain – Part 3
Additional Resources
- Inventory optimization frequently asked questions
Discussions
Very nice insights about the flaws of assuming normal distribution. I was wondering if you can throw some light on calculating safety stock for non-normal distributions?
Thank you
My view is that we should focus traditional inventory optimization approaches to those areas of the curve that approximate a Normal distribution and offer different services for the other areas of the curve.
For example, if you have determined that your demand follows a LogNormal distribution, use the Mode and a narrower StdDev to determine your inventory at that location. And then set different ordering policies for those demands that fall outside of the 'Normal' region, the most useful probably being longer lead times for large orders.
It is not unusual to see a Binomial lead time distribution. In this case use 2 inventory policies, one for each peak, and you inventory needs come down a lot.
Regards
Trevor
Leave a Reply