Author:
Jean-François Dubeau, Architect, Machine Learning, ML Solutions at Kinaxis
At Kinaxis, we make heavy use of Kubernetes (k8s) for our advanced analytics and machine learning modules and workflows. Our multi-step workflows encompass data preparation, feature generation, hyperparameter tuning, model training, inference, and more. Kubernetes provides automated resource allocation, scalability, and multi-cloud capability which are essential to us.
In this post, we will explain how, with just a few short declarative manifests, we track changes to our k8s resources using Argo Events. Before digging into the “how” let’s cover the “why” and describe some concepts.
Use case
Why would we want to track changes to our k8s resources? We want to allow users and some external systems to get notified of k8s resource state modifications (such as workflow progress, failures, etc.). In a nutshell, we want to make our system observable from the outside world and, to make a public relations analogy, we want to control the message.
Observability
What do we mean by “making our system observable”? Observability, a property of a system, is the ability to define its internal state and behavior based on the available outputs. We more often than not rely on logs, metrics, and traces to get insights into the system state. We try, whenever possible, to collect this information in the least intrusive ways. To do so, we use tools such as Fluentd, Prometheus, and Jaeger, but for those tools to collect data, our applications generally need to be instrumented to generate and expose the appropriate data.
K8s resource events
The Kubernetes API allows clients to track changes made to an object or a collection. Said another way, it allows clients to “watch” resource changes.
When performing a “watch” request, the API server will respond with a stream of changes, each change notification being a JSON document. Depending on the changes made to the object or collection and the way the watch is established, events of different types (such as the “ADDED”, “MODIFIED”, and “DELETED” events) will be generated.
Such event logs will allow us to “observe” part of our system state. To use it, we could write an app to manage such a watch and the associated events. A more appropriate solution would be to use an Informer (from the k8s client-go package). But there is a simpler solution: leveraging Argo Events.
Argo Events
Argo is a set of remarkably interesting and useful open-source tools.
One of them, Argo Events, is a multi-tool for event management on Kubernetes. Argo’s website describes it as an “event-driven workflow automation framework for Kubernetes”. If you’re into event-driven architectures on k8s, this framework will find a place in your toolset (and in your heart).
There are 4 important concepts:
1) Event Source
Event sources consume events from external sources, transform them into CloudEvents, and dispatch them over to the EventBus.
At the time of this writing, Argo Events supports over 20 different event sources: AMQP, AWS SNS, AWS SQS, Azure Events Hub, Bitbucket, Calendar, Emitter, File-Based Events, GCP PubSub, GitHub, GitLab, HDFS, K8s Resources, Kafka, MinIO, NATS, NetApp StorageGrid, MQTT, NSQ, Pulsar, Redis, Slack, Stripe, Webhooks.
On top of that, you can add your custom event listener.
2) Trigger
Triggers are the resources/workloads executed in response to specific events.
Argo Events supports many trigger types, such as HTTP requests, Kafka messages, NATS messages, Slack notifications, and of course Argo Workflows. You can also create any k8s resource and even bring your custom trigger.
3) Sensor
Sensors allow you to specify your trigger event dependencies (the events your trigger should respond to). It listens for the specified events on the EventBus and executes the triggers accordingly.
4) EventBus
The EventBus is the transport layer connecting the event sources and the sensors.
One benefit of Argo Events architecture is that your triggers are decoupled from the event sources, allowing you to mix and match in any way you’d like. Considering that you can bring your custom event listener and your custom trigger, the possibilities are, in effect, endless.
Tracking our k8s resources
It’s time to put those concepts to good use.
Our goal will be to surface some specific system outputs to get insights into the system state and allow actions to be taken based on this state.
We want to get notified when there are changes to our k8s resources to do something in response to such changes. To illustrate the process, we will track the progress of an inference workflow (a simplified version of our real inference workflows which we’ll run on a k3d cluster).
The details of the workflow template are unimportant. What’s important are the generated events.
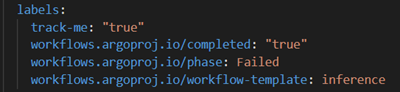
Let’s inspect one of our intentionally failed workflows (kubectl get wf). First, we notice that our workflows are labeled to indicate which phase our workflow is in and if the workflow is completed or not. Those labels are managed by Argo’s workflow controller. The “track-me” label will be explained later.
If you look at the below workflow status details, you can find lots of useful information such as the “message” (e.g. "child 'XYZ' failed"), the failed node exit code, input and output parameter values, timestamps, etc.
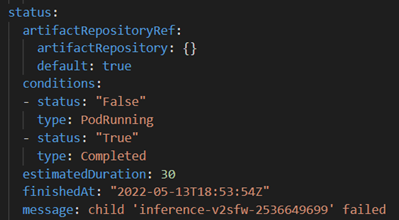
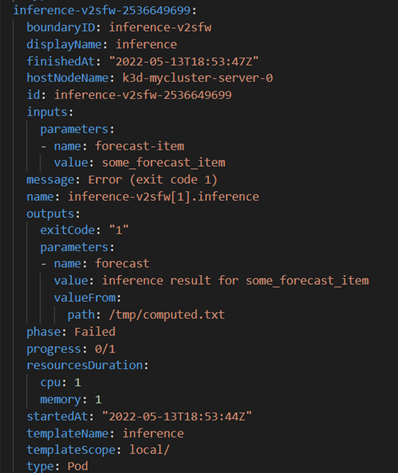
We will make use of such information in our event sources and triggers.
Using the k8s API
First, let’s try to query the k8s API directly to track such events. In other words, let’s establish a “watch” on our resources (in the “workflows” namespace, as this is where our workflow was deployed).
Let’s list our resources first:
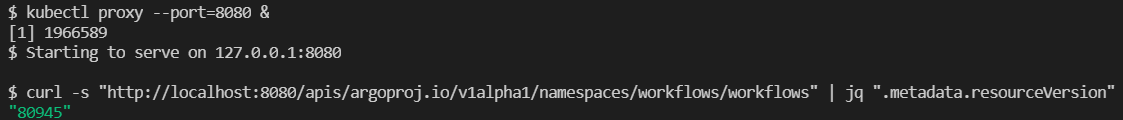
We can then establish a watch from the “resourceVersion” returned by the previous command:
![]()
Now that the watch is established, if/when workflow objects or collection changes, we get notifications. In the below-truncated capture, a workflow was “added” so we can get an “ADDED” notification first and then some “MODIFIED” notifications as the workflow progresses.

Using Argo Events
Let’s now consume such events using Argo Events.
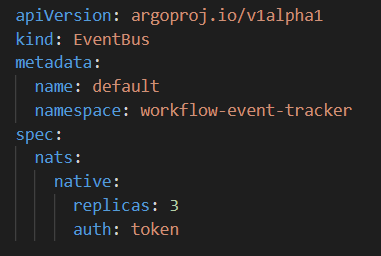
EventBus
The very first thing we need is an EventBus. Our event sources will produce events for our EventBus, and sensors will consume those events. Here is our simple “default” EventBus:
Event source
Argo Events provides the “resource” event source to make it easy to consume k8s resource change events. This event source is currently implemented using an Informer.
Here is what our event source looks like:
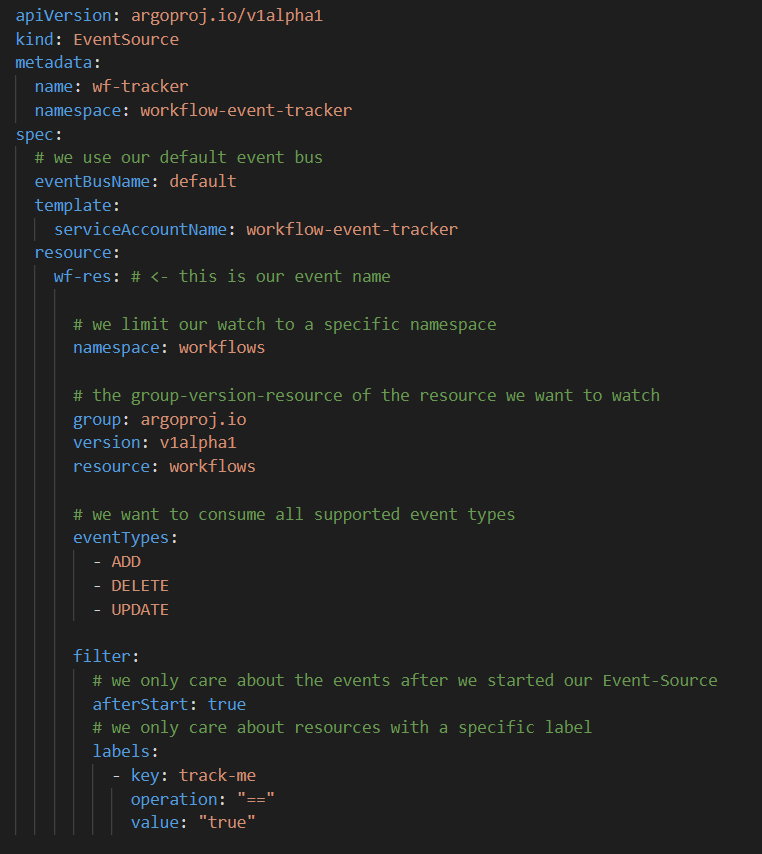
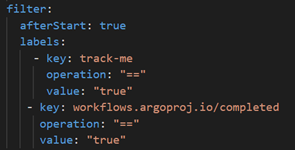
Notice the filter. We are interested to track the events of workflows explicitly labeled to be tracked (i.e., resources with the label “track-me” set to “true”. If you’re familiar with Prometheus, this is similar to annotating resources to be scrapped.
You might be wondering why “ADD”, “UPDATE”, and “DELETE”. After all, a watch request to k8s’s API will return “ADDED”, “MODIFIED”, and “DELETED” as the event type. As previously mentioned, the “resource” event source is implemented using an Informer. It implements handler functions (AddFunc, UpdateFunc, and DeleteFunc), which are called by the Informer. If you dig deeper into the Informer code, you will notice that in the reflector’s watchHandler “ADDED”, “MODIFIED”, and “DELETED” events are converted into “add”, “update”, and “delete” calls to the Informer internal store (cache).
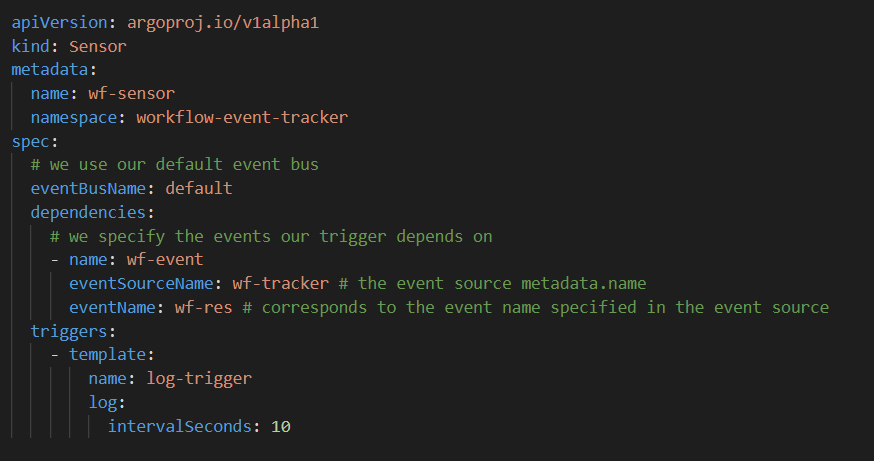
Trigger and sensor
Our first trigger will be simple, just to illustrate the concept. We’ll leverage Argo Events “log” trigger and simply log the events.
The sensor specifies that our trigger depends on a single event source and should be fired when a corresponding event is consumed from the EventBus.
Here is our sensor including the trigger:
Voilà! Those resources will allow us to track k8s events associated with specific workflows.
Trying it!
Let’s try that with our inference workflow. Submitting the workflow will generate a bunch of events that will be consumed by our event source, published on the EventBus, consumed by the sensor, and finally logged by the trigger (into the sensor pod logs). Here’s a sample from our sensor logs:

The events logs were truncated to avoid cluttering, but you can see ADD and UPDATE events being logged.
Kafka trigger
Let’s do something a bit more interesting and set up a Kafka trigger. For this, we need a Kafka cluster. Our sensor will extract some of the fields from the above events payload and publish some form of summary on a Kafka topic. Here’s the trigger we will use (using the same sensor dependencies as before):
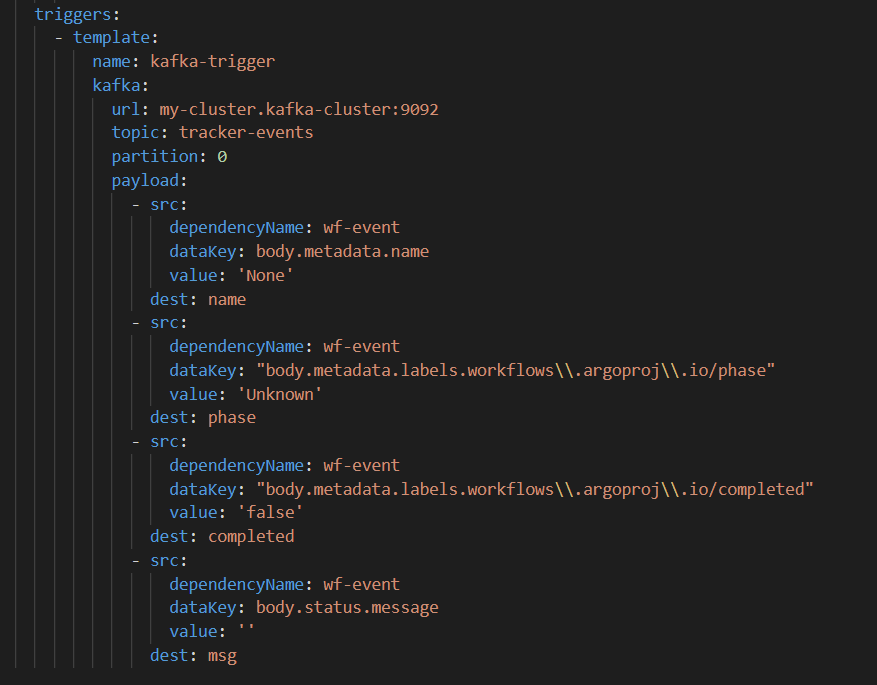
The “payload” section indicates how we build our destination payload from our sources. We see here that we’ll be making use of the name, some labels, and the optional status message.
Submitting a workflow will result in a stream of messages being published on our Kafka topic.

Consuming such messages, we could follow our workflow progress and take action.
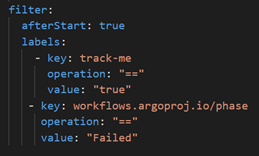
Event source filtering
What if we want to filter out all workflow events but the ones for which the workflow is either completed or failed? In some cases, we would certainly prefer to let subscribers do their own filtering, in other cases, we’d like to perform the filtering upfront. In the latter case, we could amend our event source filters like so:
Conclusion
Observable systems allow us to infer their internal state from their outputs. K8s API allows us to watch for resource changes. Argo Events makes it easy to consume k8s resource changes events and to act on them.
Our triggers were nice for illustration purposes, but we could have performed more complex processing by using a “workflow” trigger or a custom trigger. We could easily have sent emails, SMS, or other forms of notification to people regarding failed workflows for instance.
At Kinaxis, we write such events to our ML platform event bus and let subscribers (other systems) consume them. They can parse those events and take action in any way they want.