





- SaaS revenue increased 22% year-over-year to $112.3 million
- Remaining Performance Obligations increased 21% year-over-year, surpassing $1 billion
- Annual Recurring Revenue2 (ARR) increased 19% year-over-year to $483.9 million, 20% year-over-year in constant currency
- Unveiled new Agentic AI and Advanced Optimization Capabilities at Kinexions EMEA 2026
- Raises fiscal 2026 financial outlook
OTTAWA, Ontario--(BUSINESS WIRE)-- Kinaxis® Inc. (TSX:KXS), a global leader in end-to-end supply chain planning and orchestration, today announced financial results for its third quarter 2026, ended September 30, 2026. All amounts are in U.S. dollars. All figures are prepared in accordance with IFRS Accounting Standards (IFRS) unless otherwise indicated.
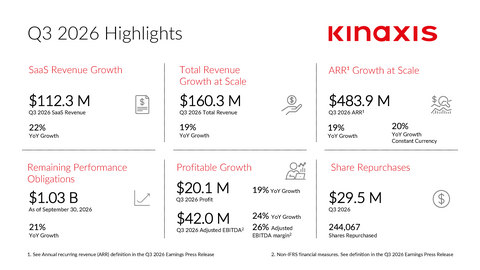
Kinaxis Q3 2026 Highlights
"Leading organizations with the most complex supply chains are partnering with Kinaxis to shorten the latency between accelerating change signals, decisions, actions, and learning cycles to achieve the best business outcomes. Our team delivered a strong third quarter, with 22% SaaS revenue growth and record remaining performance obligations exceeding $1 billion, driven by momentum among new and existing customers. Three consecutive quarters of outperformance underpin our confidence in raising full-year guidance for total revenue, SaaS revenue growth, and adjusted EBITDA margin,” said Razat Gaurav, Chief Executive Officer of Kinaxis. "We are executing on our vision to reimagine the future of supply chains by strengthening Maestro, all-in on AI, and broadening our offering with composable operational orchestration, while maintaining a clear focus on profitable growth and long-term value for customers and shareholders.”
Third Quarter 2026 Financial Highlights:
- Total revenue increased 19% year-over-year to $160.3 million. Total revenue included a negative impact of approximately $1.1 million from foreign currency exchange rates (FX).
- SaaS revenue increased 22% year-over-year to $112.3 million. SaaS revenue included a negative impact of approximately $0.8 million from FX.
- ARR 2 increased 19% year-over-year to $483.9 million. On a constant currency basis, ARR 2 increased 20% year-over-year to $486.8 million.
- Remaining performance obligations increased 21% year-over-year to $1,026.9 million.
- Profit of $20.1 million.
- Adjusted EBITDA 1 of $42.0 million, an increase of 24% year-over-year. Adjusted EBITDA margin 1 of 26%, a 102 basis points improvement year-over-year.
- Operating cash flow of $34.4 million.
Financial Highlights
$ USD thousands, except as otherwise indicated | Q3 2026 | Q3 2025 | Change |
Total Revenue | 160,264 | 134,592 | 19% |
SaaS | 112,301 | 91,955 | 22% |
Subscription term licenses | 1,169 | 79 | 1380% |
Professional services | 42,164 | 37,022 | 14% |
Maintenance and support | 4,630 | 5,536 | (16)% |
Gross profit
| 104,491
| 85,949
| 22% |
Profit
| 20,097
| 16,846
| 19% |
Adjusted EBITDA1
| 42,024
| 33,922
| 24% |
Cash flows from operating activities | 34,383 | 33,645 | 2% |
(1) “Adjusted EBITDA” is a non-IFRS measure that is not a recognized, defined or standardized measure under IFRS. This measure as well as any other non-IFRS financial measures reported by Kinaxis are defined in the “Non-IFRS Measures” section of this news release. | |||
Annual Recurring Revenue
Annual Recurring Revenue2 (ARR), which includes subscription amounts related to both SaaS and on-premise contracts, increased 19% year-over-year to $483.9 million at the end of the quarter. On a constant currency basis, ARR2 increased 20% year-over-year to $486.8 million at the end of the quarter.
$USD millions | Q3 2026 | Q3 2025 | Change |
Annual recurring revenue2 | 483.9 | 406.7 | 19% |
(2) Annual Recurring Revenue (ARR) is the total annualized value of recurring subscription amounts (ultimately recognized as SaaS, Subscription term licenses and Maintenance and support revenue) of all subscription contracts at a point in time. Annualized subscription amounts are determined solely by reference to the underlying contracts, normalizing for the varying revenue recognition treatments under IFRS 15 for cloud-based versus on-premise subscription amounts. It excludes one-time fees, such as for non-recurring professional services, and assumes that customers will renew the contractual commitments on a periodic basis as those commitments come up for renewal, unless such renewal is known to be unlikely. We believe that this measure provides a more current indication of our performance in the growth of our subscription business than other metrics. | |||
Remaining Performance Obligations
The nature of the company’s long-term contracts provides visibility into future, contracted revenue. The following table presents revenue expected to be recognized in the future related to performance obligations that are unsatisfied (or partially unsatisfied) at September 30, 2026. Remaining performance obligations increased 21% year-over-year to $1,026.9 million.
$USD millions | Remainder of
| 2027 | 2028 and later | Total |
SaaS | 114.2 | 393.6 | 471.2 | 979.1 |
Maintenance and support | 4.5 | 16.7 | 15.7 | 36.9 |
Subscription term licenses | 7.2 | 3.4 | 0.3 | 10.9 |
Total | 125.9 | 413.7 | 487.2 | 1,026.9 |
Share Repurchases:
- During the third quarter 2026, the Company spent $29.5 million to repurchase 244,067 shares of its common stock at an average price of $120.79. Since the start of the current share repurchase program, the Company has reduced its total outstanding share count by 3.5% as of September 30, 2026, on a net basis.
Customer Momentum: The Company continued to see strong adoption of Maestro and other solutions across a wide range of industries and geographies. Notable customer updates include:
- New customers include Dr. Squatch, an American personal care and grooming company; Sterlite Technologies Limited (STL), a leading optical and digital solutions company; WAI Global (Wetherill Associates, Inc.), a global manufacturer and distributor of automotive aftermarket components; a European luxury goods company; a leading biotechnology company; and a global consumer health company transitioned away from a competitor.
- Customer renewals or expansions include Clariant, one of the world's leading specialty chemicals companies; Sanofi, an R&D driven, AI-powered biopharma company; an American multinational automotive manufacturer; a leading consumer healthcare platform in Europe; and a leading European pet food company.
- In the third quarter 2026, the Company completed more than 40 customer go-lives, including Asahi Beverages, the leading beverage company in Oceania; a leading business aviation engine supplier; a leading U.S. energy company; a global healthcare and medical technology company; and a manufacturer of software-enabled hardware solutions.
Innovation:
- At Kinexions EMEA 2026 in October, the Company announced several new AI and optimization capabilities in Maestro that reduce friction between sophisticated technology and practical adoption, making advanced AI, optimization, and data capabilities easier for customers to use in everyday operations. These included:
- Maestro Conversational and Agentic AI: Moves beyond answering questions to understanding your business and taking intelligent action, powered by rich business knowledge and semantic intelligence;
- AI-enabled workflows: Integrates LLMs and agents directly into automated processes in Maestro, reducing the need for human intervention by enabling AI to interpret context, evaluate information, and make recommendations;
- Agent evaluation and reasoning visibility: New capabilities that help users assess, understand, and improve Maestro Agents’ behavior; and
- Advanced Inventory Optimization solution: New explainability capabilities that give planners greater visibility into the factors driving inventory calculations and recommendations, helping build trust in optimization outputs.
- Announced the availability of the Kinaxis Data Fabric, providing governed supply chain data and business context for AI and analytics. Data Publish, a new Data Fabric capability, simplifies the process of making Kinaxis data available for downstream analytics.
- Launched Model Context Protocol (MCP) connectivity capabilities for Microsoft 365, enabling Maestro Agents to connect to other enterprise applications and extend the information and tools available to agents within their workflows. Capabilities include Microsoft Copilot and Microsoft Teams interactions with agents built and operating in Maestro, the ability to poll and receive relevant notifications from Microsoft WorkIQ and WebIQ directly in Maestro, and the ability to trigger intelligent automations and agentic workflows.
Recognition:
- Recognized as a Leader by Nucleus Research Enterprise Supply Chain Planning Value Matrix 2026.
- Recognized as a Leader by ARC MarketMap Supply Chain Decision Intelligence 2026.
Upcoming Investor Conferences:
- On Tuesday, November 17, 2026, the Company is scheduled to host investor meetings at the RBC Global Technology, Internet, Media and Telecommunications Conference in New York, NY.
- On Monday, November 23, 2026, the Company is scheduled to participate in a fireside chat discussion at the TD Cowen 18th Annual Technology Conference in Toronto, Canada, at 2:00 p.m. Eastern Time. A live webcast and replay will be available on the Company's Investor Relations website.
- On Wednesday, December 2, 2026, the Company is scheduled to host investor meetings at the UBS Global Technology and AI Conference in Scottsdale, AZ.
- On Tuesday, December 8, 2026, the Company is scheduled to participate in a fireside chat discussion at the Raymond James TMT and Consumer Conference in New York, NY, at 8:40 a.m. Eastern Time. A live webcast and replay will be available on the Company's Investor Relations website.
- On Wednesday, December 9, 2026, the Company is scheduled to host investor meetings at the Barclays 24th Annual Global Technology Conference in San Francisco, CA.
Fiscal 2026 Financial Outlook:
Based on information available as of November 4, 2026, financial guidance for fiscal 2026 is as follows:
- Raising total revenue from $625.0 million to $640.0 million to a range of $640.0 million to $650.0 million.
- Raising SaaS revenue growth from 18% to 20% year-over-year to a range of 20% to 21% year-over-year.
- Raising Adjusted EBITDA 1 margin from 25% to 26% range to 26.5% to 27.5% range.
In addition to the above guidance, the Company is also providing fiscal 2026 FX estimates for modeling purposes. We expect FX to have a negative impact on total revenue by approximately $3.5 million to $4.0 million. We expect FX to have a negative impact on SaaS revenue by approximately $2.0 million to $2.5 million.
In addition to the above guidance, the Company is also providing fiscal 2026 weighted-average number of basic and diluted share estimates for modeling purposes. We expect basic weighted-average shares outstanding to be approximately 27.3 million shares and diluted weighted-average shares outstanding to be approximately 27.9 million shares. These share count forecasts do not include the impact of any share repurchases the Company may pursue in the future.
Guidance in this press release is provided to enhance visibility into Kinaxis’ expectations for financial targets for the periods indicated. Please refer to the section regarding forward-looking statements that forms an integral part of this release. This press release along with the financial statements and MD&A for the quarter ended September 30, 2026, are available on Kinaxis’ website and on SEDAR+ at www.sedarplus.ca.
Conference Call Details:
Kinaxis will host a conference call tomorrow, November 5, 2026, to discuss third quarter 2026 financial results and financial outlook for fiscal 2026 at 8:30 a.m. Eastern Time. A live webcast of the conference call will be available on the Investor Relations section of Kinaxis’s website at investors.kinaxis.com where presentation materials will also be posted prior to the conference call. A replay will be available online approximately two hours following the live call for a period of 30 days.
DATE: | Thursday, November 5, 2026 | |||||
TIME: | 8:30 a.m. Eastern Time | |||||
WEBCAST |
About Kinaxis Inc.
Kinaxis is a global leader in modern supply chain planning and orchestration, powering complex global supply chains and supporting the people who manage them. Our powerful, AI-infused supply chain orchestration platform, Kinaxis Maestro®, combines proprietary technologies and techniques that provide full transparency and agility across the entire supply chain — from multi-year strategic planning to last-mile delivery. We are trusted by renowned global brands to provide the agility and predictability needed to navigate today’s volatility and disruption. For more news and information, please visit kinaxis.com or follow us on LinkedIn.
Non-IFRS Measures
This press release makes reference to Adjusted Profit and Adjusted EBITDA, which are non-IFRS financial measures, as well as Adjusted EBITDA margin which expresses Adjusted EBITDA as a percentage of revenue. Adjusted Profit, Adjusted EBITDA and Adjusted EBITDA margin are not recognized, defined or standardized measures under IFRS. We use these measures to provide investors with supplemental information on our operating performance and to highlight trends in our core business that may not otherwise be apparent when relying solely on IFRS financial measures. We believe that securities analysts, investors and other interested parties frequently use non-IFRS measures in the evaluation of issuers. Providing these non-IFRS measures provides useful information because they portray the financial results of the Company before certain expenses that do not impact the ongoing operating decisions taken by management. Management also uses non-IFRS measures in order to facilitate operating performance comparisons from period to period, prepare annual operating budgets and assess our ability to meet our capital expenditure and working capital requirements, and to determine components of employee compensation.
Adjusted Profit represents profit adjusted to exclude our equity compensation plans. Adjusted EBITDA represents profit adjusted to exclude our equity compensation plans, income tax expense, depreciation and amortization, foreign exchange loss (gain) and net finance (income) expense. Adjusted EBITDA margin expresses Adjusted EBITDA as a percentage of revenue. Our definitions of Adjusted Profit, Adjusted EBITDA and Adjusted EBITDA margin will likely differ from those used by other companies (including our peers) and therefore comparability may be limited. Non-IFRS measures should not be considered a substitute for or in isolation from measures prepared in accordance with IFRS. Investors are encouraged to review our financial statements and disclosures in their entirety and are cautioned not to put undue reliance on non-IFRS measures and view them in conjunction with the most comparable IFRS financial measures. Kinaxis has reconciled Adjusted Profit and Adjusted EBITDA to the most comparable IFRS financial measure as follows:
Three months ended September 30, | Nine months ended September 30, | |||||||||||||
2026 | 2025 | 2026 | 2025 | |||||||||||
(In thousands of USD) | (In thousands of USD) | |||||||||||||
Profit | 20,097 | 16,846 | 70,715 | 51,198 | ||||||||||
Share-based compensation | 13,544 | 10,031 | 34,264 | 29,752 | ||||||||||
Adjusted profit | 33,641 | 26,877 | 104,979 | 80,950 | ||||||||||
Income tax expense | 5,589 | 5,361 | 26,634 | 14,858 | ||||||||||
Depreciation and amortization | 4,471 | 4,856 | 13,715 | 15,261 | ||||||||||
Foreign exchange loss (gain) | 962 | (192 | ) | (843 | ) | (2,205 | ) | |||||||
Net finance income | (2,639 | ) | (2,980 | ) | (7,505 | ) | (8,069 | ) | ||||||
8,383 | 7,045 | 32,001 | 19,845 | |||||||||||
Adjusted EBITDA | 42,024 | 33,922 | 136,980 | 100,795 | ||||||||||
Adjusted EBITDA as a percentage of revenue | 26 | % | 25 | % | 28 | % | 25 | % | ||||||
Forward-Looking Statements
Certain statements in this release constitute forward-looking statements, future-oriented financial information and financial outlook within the meaning of applicable securities laws. Forward-looking statements, future-oriented financial information and financial outlook include statements as to our expectations for:
- growth of annual total revenue, annual SaaS revenue growth, Adjusted EBITDA margin achievement, foreign exchange impacts on total revenue and SaaS revenue, and basic and diluted weighted-average shares outstanding, in each case looking forward for our fiscal year ending December 31, 2026;
- SaaS growth and increased profitability in years beyond 2026; and
- contracted revenue in future periods, including 2026, 2027 and 2028 and later.
This release also includes forward-looking statements as to Kinaxis’ strategies, plans and objectives, growth opportunities and the anticipated functionality, capabilities, performance and benefits of, and markets and demand for, Kinaxis’ products, services and technologies, including its AI-related offerings and capabilities. These statements are subject to certain assumptions, risks and uncertainties, including our view of the relative position of Kinaxis’ products and services compared to competitive offerings in the industry, the development, release and customer adoption of new and enhanced products and capabilities, and the pace of change in AI technologies.
In particular, our guidance for 2026 annual total revenue, annual SaaS revenue growth and annual Adjusted EBITDA margin, as well as our comments on our expectations for SaaS growth and increased profitability in years beyond 2026, are subject to certain assumptions and associated risks including:
- our ability to win business from new customers and expand business from existing customers;
- the timing of new customer wins and expansion decisions by our existing customers;
- maintaining our customer retention levels, and specifically, that customers will renew contractual commitments on a periodic basis as those commitments come up for renewal, at rates consistent with our historic experience;
- anticipated trends, standards and challenges in our business and the markets we operate in;
- fluctuations in the value of foreign currencies relative to the U.S. Dollar, including as they affect our estimates of foreign exchange impacts on total revenue and SaaS revenue; and
- with respect to Adjusted EBITDA and profitability, our ability to contain expense levels while expanding our business.
Our guidance and commentary for achievement of contracted revenue in future periods, including in 2026, 2027 and 2028 and later, is based on assumptions and associated risks including:
- our ability to satisfy material unperformed obligations under our long-term contracts; and
- the continued financial capacity and creditworthiness of our customers under long-term contracts.
These and other assumptions, risks and uncertainties may cause Kinaxis’ actual results, performance, achievements and developments to differ materially from the results, performance, achievements or developments expressed or implied by forward-looking statements, future-oriented financial information or financial outlook. Material risks and uncertainties relating to our business are described under the headings “Forward-Looking Statements” and “Risks and Uncertainties” in our annual MD&A dated March 4, 2026, and under the heading “Risk Factors” in our Annual Information Form dated March 4, 2026, which are available at www.sedarplus.ca. Readers are cautioned that the assumptions used in the preparation of forward-looking statements, future-oriented financial information and financial outlook, although considered reasonable at the time of preparation, may prove to be imprecise or inaccurate and, as such, undue reliance should not be placed on such information. Our actual results, performance and achievements could differ materially from those expressed in, or implied by, such forward-looking statements, future-oriented financial information or financial outlook. Forward-looking statements, future-oriented financial information and financial outlook are provided to help readers understand management’s expectations as at the date of this release and may not be suitable for other purposes. Readers are cautioned not to place undue reliance on forward-looking statements. Kinaxis assumes no obligation to update or revise any forward-looking statements, future-oriented financial information or financial outlook whether as a result of new information, future events or otherwise, except as expressly required by law.
SOURCE: Kinaxis Inc.
Kinaxis Inc. | ||||||
| Condensed Consolidated Interim Statements of Financial Position | ||||||
| (Expressed in thousands of USD) | ||||||
September 30,
| December 31,
| |||||
Assets | ||||||
Current assets: | ||||||
Cash and cash equivalents | $ | 159,127 | $ | 149,614 | ||
Short-term investments | 158,727 | 175,095 | ||||
Trade and other receivables | 180,370 | 165,781 | ||||
Prepaid expenses | 19,433 | 15,743 | ||||
517,657 | 506,233 | |||||
Non-current assets: | ||||||
Unbilled receivables | 1,622 | 1,596 | ||||
Other receivables | 1,015 | 1,047 | ||||
Prepaid expenses | 2,332 | 1,558 | ||||
Deferred tax assets | 17,297 | 18,225 | ||||
Contract acquisition costs | 40,931 | 37,038 | ||||
Property and equipment | 24,789 | 28,526 | ||||
Right-of-use assets | 41,638 | 43,090 | ||||
Intangible assets | 8,085 | 10,804 | ||||
Goodwill | 75,487 | 76,597 | ||||
213,196 | 218,481 | |||||
$ | 730,853 | $ | 724,714 | |||
Liabilities and Shareholders’ Equity | ||||||
Current liabilities: | ||||||
Trade payables and accrued liabilities | $ | 91,012 | $ | 90,040 | ||
Deferred revenue | 189,313 | 161,060 | ||||
Lease obligations | 5,481 | 5,938 | ||||
285,806 | 257,038 | |||||
Non-current liabilities: | ||||||
Lease obligations | 39,763 | 42,065 | ||||
Deferred tax liabilities | 565 | 4,042 | ||||
40,328 | 46,107 | |||||
Shareholders’ equity: | ||||||
Share capital | 403,378 | 363,246 | ||||
Accumulated other comprehensive loss | (3,663 | ) | (223 | ) | ||
Retained earnings | 5,004 | 58,546 | ||||
404,719 | 421,569 | |||||
$ | 730,853 | $ | 724,714 | |||
Kinaxis Inc. | |||||||||||
Condensed Consolidated Interim Statements of Comprehensive Income | |||||||||||
(Expressed in thousands of USD, except share and per share data) | |||||||||||
Three months ended September 30, | Nine months ended September 30, | ||||||||||
2026 | 2025 | 2026 | 2025 | ||||||||
Revenue | $ | 160,264 | $ | 134,592 | $ | 484,615 | $ | 403,795 | |||
Cost of revenue | 55,773 | 48,643 | 161,672 | 143,776 | |||||||
Gross profit | 104,491 | 85,949 | 322,943 | 260,019 | |||||||
Operating expenses: | |||||||||||
Selling and marketing | 30,264 | 26,440 | 92,487 | 86,867 | |||||||
Research and development | 29,666 | 23,829 | 85,607 | 68,393 | |||||||
General and administrative | 20,547 | 16,658 | 56,050 | 49,065 | |||||||
80,477 | 66,927 | 234,144 | 204,325 | ||||||||
24,014 | 19,022 | 88,799 | 55,694 | ||||||||
Other income: | |||||||||||
Foreign exchange gain (loss) | (962 | ) | 192 | 843 | 2,205 | ||||||
Net finance and other income | 2,634 | 2,993 | 7,707 | 8,157 | |||||||
1,672 | 3,185 | 8,550 | 10,362 | ||||||||
Profit before income taxes | 25,686 | 22,207 | 97,349 | 66,056 | |||||||
Income tax expense | 5,589 | 5,361 | 26,634 | 14,858 | |||||||
Profit | 20,097 | 16,846 | 70,715 | 51,198 | |||||||
Other comprehensive income (loss): | |||||||||||
Items that are or may be reclassified subsequently to profit | |||||||||||
Foreign currency translation differences - foreign operations | 677 | (499 | ) | (2,489 | ) | 3,511 | |||||
Change in valuation of cash flow hedges | 235 | (1,314 | ) | (951 | ) | 860 | |||||
912 | (1,813 | ) | (3,440 | ) | 4,371 | ||||||
Total comprehensive income | $ | 21,009 | $ | 15,033 | $ | 67,275 | $ | 55,569 | |||
Basic earnings per share | $ | 0.74 | $ | 0.60 | $ | 2.58 | $ | 1.82 | |||
Weighted average number of basic Common Shares | 27,187,538 | 28,229,298 | 27,413,939 | 28,198,655 | |||||||
Diluted earnings per share | $ | 0.72 | $ | 0.58 | $ | 2.52 | $ | 1.77 | |||
Weighted average number of diluted Common Shares | 27,752,681 | 28,842,164 | 28,049,514 | 28,909,065 | |||||||
Kinaxis Inc. | |||||||||||||||||||||
Condensed Consolidated Interim Statements of Changes in Shareholders’ Equity | |||||||||||||||||||||
(Expressed in thousands of USD) | |||||||||||||||||||||
Accumulated other comprehensive income (loss) | |||||||||||||||||||||
Share capital | Contributed surplus | Cash flow
| Currency
| Total | Retained earnings | Total equity | |||||||||||||||
Balance, December 31, 2024 | $ | 329,312 | $ | 12,078 | $ | (1,203 | ) | $ | (2,644 | ) | $ | (3,847 | ) | $ | 57,968 | $ | 395,511 | ||||
Profit | — | — | — | — | — | 51,198 | 51,198 | ||||||||||||||
Other comprehensive income | — | — | 860 | 3,511 | 4,371 | — | 4,371 | ||||||||||||||
Total comprehensive income | — | — | 860 | 3,511 | 4,371 | 51,198 | 55,569 | ||||||||||||||
Share options exercised | 25,766 | (6,156 | ) | — | — | — | — | 19,610 | |||||||||||||
Restricted share units vested | 21,547 | (21,547 | ) | — | — | — | — | — | |||||||||||||
Deferred share units vested | 810 | (810 | ) | — | — | — | — | — | |||||||||||||
Performance share units vested | 3,553 | (3,553 | ) | — | — | — | — | — | |||||||||||||
Share-based payments | — | 30,700 | — | — | — | — | 30,700 | ||||||||||||||
Shares repurchased | (5,455 | ) | (10,712 | ) | — | — | — | (44,855 | ) | (61,022 | ) | ||||||||||
Change in obligation for share repurchases | 6,668 | — | — | — | — | — | 6,668 | ||||||||||||||
Total shareholder transactions | 52,889 | (12,078 | ) | — | — | — | (44,855 | ) | (4,044 | ) | |||||||||||
Balance, September 30, 2025 | $ | 382,201 | $ | — | $ | (343 | ) | $ | 867 | $ | 524 | $ | 64,311 | $ | 447,036 | ||||||
Balance, December 31, 2025 | 363,246 | — | 136 | (359 | ) | (223 | ) | 58,546 | 421,569 | ||||||||||||
Profit | — | — | — | — | — | 70,715 | 70,715 | ||||||||||||||
Other comprehensive loss | — | — | (951 | ) | (2,489 | ) | (3,440 | ) | — | (3,440 | ) | ||||||||||
Total comprehensive income (loss) | — | — | (951 | ) | (2,489 | ) | (3,440 | ) | 70,715 | 67,275 | |||||||||||
Share options exercised | 21,723 | (5,472 | ) | — | — | — | — | 16,251 | |||||||||||||
Restricted share units vested | 25,672 | (25,672 | ) | — | — | — | — | — | |||||||||||||
Performance share units vested | 8,042 | (3,564 | ) | — | — | — | (4,478 | ) | — | ||||||||||||
Share-based payments | — | 34,708 | — | — | — | — | 34,708 | ||||||||||||||
Shares repurchased | (19,762 | ) | — | — | — | — | (119,779 | ) | (139,541 | ) | |||||||||||
Change in obligation for share repurchases | 4,457 | — | — | — | — | — | 4,457 | ||||||||||||||
Total shareholder transactions | 40,132 | — | — | — | — | (124,257 | ) | (84,125 | ) | ||||||||||||
Balance, September 30, 2026 | $ | 403,378 | $ | — | $ | (815 | ) | $ | (2,848 | ) | $ | (3,663 | ) | $ | 5,004 | $ | 404,719 | ||||
Kinaxis Inc. | ||||||||||||
Condensed Consolidated Interim Statements of Cash Flows | ||||||||||||
(Expressed in thousands of USD) | ||||||||||||
Three months ended September 30, | Nine months ended September 30, | |||||||||||
2026 | 2025 | 2026 | 2025 | |||||||||
Cash flows from operating activities | ||||||||||||
Profit | $ | 20,097 | $ | 16,846 | $ | 70,715 | $ | 51,198 | ||||
Items not affecting cash: | ||||||||||||
Depreciation of property and equipment and right-of-use assets | 3,668 | 4,002 | 11,266 | 12,770 | ||||||||
Amortization of intangible assets | 803 | 854 | 2,449 | 2,491 | ||||||||
Share-based payments | 13,544 | 10,031 | 34,264 | 29,752 | ||||||||
Net finance income | (2,639 | ) | (2,980 | ) | (7,505 | ) | (8,069 | ) | ||||
Income tax expense | 5,589 | 5,361 | 26,634 | 14,858 | ||||||||
Change in operating assets and liabilities | 2,036 | 1,822 | 12,255 | 8,999 | ||||||||
Interest received | 2,671 | 3,635 | 8,558 | 9,606 | ||||||||
Interest paid | (367 | ) | (520 | ) | (1,174 | ) | (1,450 | ) | ||||
Income taxes paid | (11,019 | ) | (5,406 | ) | (33,286 | ) | (32,297 | ) | ||||
34,383 | 33,645 | 124,176 | 87,858 | |||||||||
Cash flows from (used in) investing activities | ||||||||||||
Purchase of property and equipment | (648 | ) | (747 | ) | (3,147 | ) | (5,015 | ) | ||||
Purchase of short-term investments | (137,028 | ) | (164,592 | ) | (297,520 | ) | (454,481 | ) | ||||
Redemption of short-term investments | 114,683 | 162,139 | 313,863 | 372,748 | ||||||||
(22,993 | ) | (3,200 | ) | 13,196 | (86,748 | ) | ||||||
Cash flows used in financing activities | ||||||||||||
Payment of lease obligations | (1,649 | ) | (1,424 | ) | (4,652 | ) | (4,367 | ) | ||||
Repurchase of shares | (29,479 | ) | (25,368 | ) | (137,800 | ) | (61,022 | ) | ||||
Proceeds from exercise of stock options | 2,694 | 794 | 16,251 | 19,610 | ||||||||
(28,434 | ) | (25,998 | ) | (126,201 | ) | (45,779 | ) | |||||
Increase (decrease) in cash and cash equivalents | (17,044 | ) | 4,447 | 11,171 | (44,669 | ) | ||||||
Cash and cash equivalents, beginning of period | 174,607 | 123,754 | 149,614 | 172,192 | ||||||||
Effects of exchange rates on cash and cash equivalents | 1,564 | (1,725 | ) | (1,658 | ) | (1,047 | ) | |||||
Cash and cash equivalents, end of period | $ | 159,127 | $ | 126,476 | $ | 159,127 | $ | 126,476 | ||||
Investor Relations
Victoria Hyde-Dunn | Kinaxis
vhyde-dunn@kinaxis.com
Media Relations
Matt Tatham | Kinaxis
mtatham@kinaxis.com