What is demand? While many have heard of the concept of demand, if you were to ask a random set of people to define it, answers would vary greatly. Those whose knowledge on the topic exceeds no further than a high-school economics course may tell you that demand is the general need for a product among a population.
Someone else who’s taken a microeconomics course at the university level will go into a bit more detail, describing demand as the need for a product among a population, which increases or decreases based on price, if all other factors are held equal. A third person, one who devoted their entire life to the field of economics, will dig deeper into the numerous factors impacting demand, the differences in the definition of demand, and how that can change based on why we’re calculating it in the first place.
In theory, the definition of demand is well established and does not change. Practitioners looking to forecast demand, however, can’t rely on such definitions. Why? It’s simple. Take for example Investopedia’s definition of demand:
Demand is an economic principle referring to a consumer's desire to purchase goods and services and willingness to pay a price for a specific good or service.
Let's talk about that word desire. How do you measure a person’s desire? How do you measure their lack of desire? Perhaps it's a willingness to pay a price. Is this willingness shared across all people for all products? What impacts this willingness? The answers to these questions will determine how accurate your forecasts are.
As a forecasting team, it’s important to have a consistent philosophy regarding how you perceive demand. In this article, we’ll walk through the philosophy we’ve developed throughout the entire machine learning team at Kinaxis, and how this philosophy helps separate us from our competitors.
Is quantity sold a good measure of demand?
What makes the forecasting of demand so difficult is the fact that it isn’t directly measurable. That is, there’s no one function D, where if given inputs {P, X1, X2,…, Xm}, will give you the value of demand for some product P. Instead, you’ll need to forecast for what you think is the best estimate of demand. Most tend to use a measurable proxy as that best estimate, let’s call this proxy quantity sold (Q) for now.
But how good of an estimator is Q? Is it valid to conclude that the demand of an item is solely determined by the number of people who have bought said item? To answer this question, I like to think of people who sign up for raffles of a limited release. If 1,000 people sign up for the raffle, but only 10 get the product, does that mean the demand for the product was 10, or 1,000? Similarly, if you go to the grocery store with the intention to buy milk, but there’s no milk available, does that reduce the demand for milk on that day by one? Not necessarily. You still had the desire to buy milk, there just wasn’t any left.
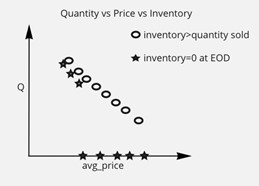
This brings us to a conclusion: Quantity sold is limited by inventory, while demand isn’t. To best explain this, consider figure one, where we compare Q, price, and inventory. If we were to assume unlimited inventory, our demand would be different than if we had limited inventory. This is a key point when estimating demand. Considering these cases, where the demand is there but it can’t be fulfilled, is crucial for an accurate forecasting tool.
But it isn’t the only limiting factor. Another thing to consider is the stage of the “product lifecycle” an item is at. If the product has yet to be introduced to the market, and sellers want to get an understanding of what the demand for such an item will be, then maybe you don’t even need a machine learning model. Your demand can be estimated via a simple survey. Once that item is introduced to the market, you don’t even have historical data to train your model on; hence, no sense of the change in quantity sold throughout the years.
Note that we’ve been using quantity sold as the proxy for demand. This assumes a specific customer for whom we’re forecasting: retailers. If instead, for example, we were to forecast for a manufacturer, we would no longer use quantity sold as a proxy for demand, but instead, quantity shipped. The difference? There are many. One example is the amount of data. A retailer’s data is significantly larger than that of a manufacturer. Also, there are a lot fewer zeros in a manufacturer’s data. How do you ship zero items? Doesn’t quite make sense.
The conclusion: forecasting demand for one vertical comes with a complete new set of nuances when compared to some other vertical. A “one size fits all” solution is practically impossible to achieve, hence your forecasting solution will have to adapt.
Best estimate of demand
So then, if quantity sold has all these problems, what do we do to forecast demand? We use quantity sold (or quantity shipped, or whatever proxy suits your vertical best). It may not be demand, but it’s the next best thing. And as the old saying goes, all models are wrong, but some are useful. The idea then becomes to try to alleviate all these problems to the best of our ability. And here’s how.
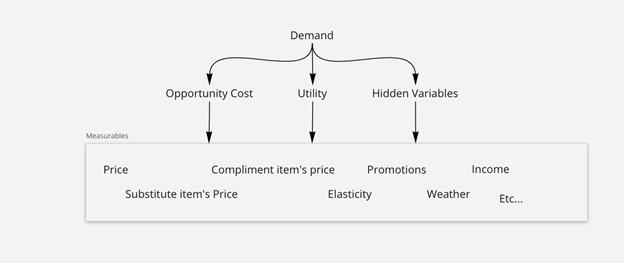
We see demand as a function of three variables:
- Opportunity cost: The potential benefits that an individual, investor, or business misses out on when choosing one alternative over another.
- Utility: The total satisfaction received from consuming a good or service.
- Hidden variables (an error term if you’d like): Any external event causing a shift in demand (for example, a supply chain disruption, or bad weather).
Just as demand isn’t directly measurable, neither is opportunity cost, nor utility, nor these hidden variables. So, we end up with the same problem: nothing is measurable. But we can continue dissecting the three until we get to a bunch of variables that are measurable. Things like the price of an item, the price of an item’s substitutes, the promotions on an item. All of these are features that’ll either increase or decrease the desire and willingness of a person to buy an item, leaving us with a pretty good estimate of demand.
Figure two illustrates this idea and shows how we can end up with an equation for demand (quantity sold) that provides a not-so-rough prediction.
Conclusion
Demand is theoretically a well-defined concept. We all have demands. Every time we go to the grocery store or sign up for emails about a brands latest promotions and releases, we’re expressing a certain interest in what someone is selling. We understand our own demands, and what aspects influence our desires.
Things get difficult when we try to predict other people’s demands. We don’t know what others like, what others dislike, what aspects influence other people’s opinions, and how to measure these aspects. That’s what makes demand forecasting so difficult. And in this article, we dove deep into this notion.
We discussed the differences between quantity sold and demand, and how the best forecasting model will understand these disadvantages and make up for them. One point we didn’t touch on in this article is the differences in our forecasting method based on why we’re forecasting demand. Are we forecasting to determine the best promotion to apply on a product? Or are we looking to optimize our inventory management?
Understanding the reason behind a forecast will change the way in which we determine demand, but this deserves an article of its own, so we’ll leave it for next time.